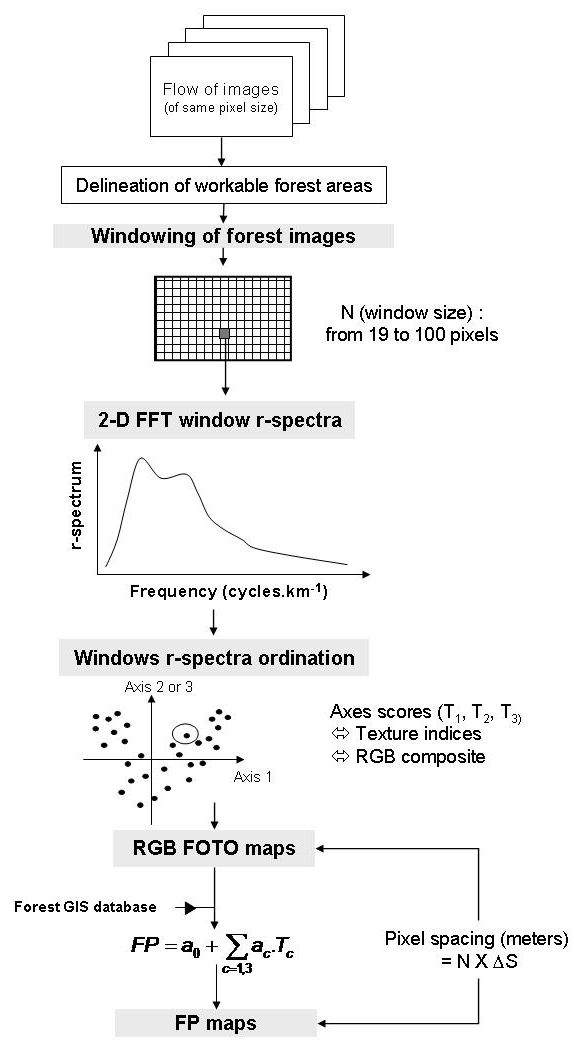
1) A flow of images of same pixel size
must be first selected. (No restriction about study sites or sensor type.)
For each region considered, a visual delineation of forest areas aims to
mask non-forest areas that will be not entered in the FOTO analysis. Efficiency
could be reached if permanent masks over rivers, roads, swamps areas,
cities are stored independently of specific cloud cover masks that
have to be constructed for each image. Resulting masked images are stored
within directories of the TEXTUREMOD package and using name coding.
2) From windows size value specified through
the graphical interface, the program computes a grid which has as many
cells or windows as image dimensions in rows and columns allow.
3) The 2-D FFT is applied to all windows
pooling their r-spectra sampled values in
a spectra table. Accordingly, it has as many rows as the
number of rows matching the number of image windows whereas number of columns
remains equal with N/2, the number of sampled frequencies (N/2 corresponds
to the Nyquist frequency). Additional information including
window location within the image was also stored on supplementary columns
so that periodograms of any geographical area could be easily extracted
and analyzed. Refer to bibliography
for further details.
4) The table of spectra is further submitted
to a standardized PCA, that is eigenvector analysis of the correlation
matrix between spatial frequencies. The three prominent principal components
are used as texture indices (T1, T2, T3) to ordinate
windows along texture gradients with a maximum of variance
explained.
5) FOTO maps are produced
from re-construction of windows grids and by directly applying PC scores
as intensity values of a given windows (or pixel). A RGB composite image
is then obtained from the first three axes.
6) Thanks to forest parameters table (as given
by EXCEL sheet), TEXTUREMOD proposes a basic linear regression analysis
of relationships between forest parameters and the three FOTO indices. Inversion relationships is finally applied to the
associated FOTO map and a given forest parameter map
is automatically produced, respecting all geo-registering information.
|
Figure 2: Processing
algorithm followed by TEXTUREMOD. FP means forest parameter. Click on
figure to enlarge.
|